July 2026 – Market Insight Report

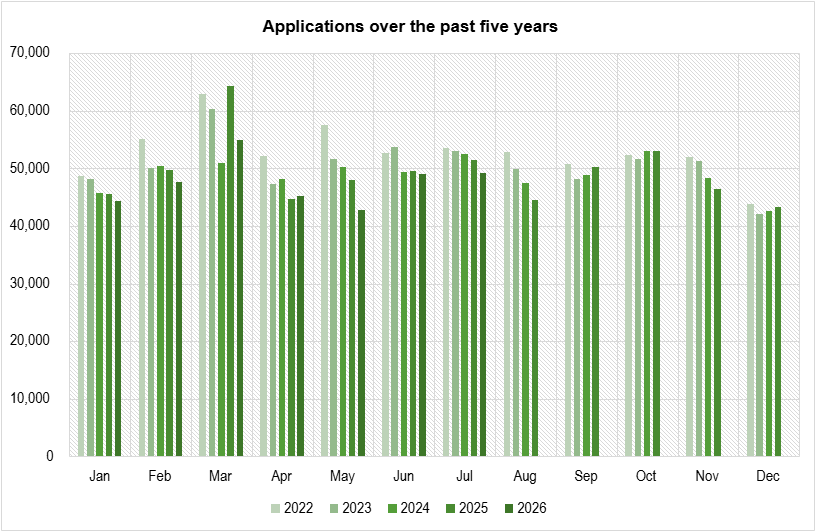
Planning application activity remained broadly stable in July 2026, with 49,135 applications submitted during the month. This represents little change compared to June 2026, although application numbers were 5% lower than in July 2025.
While overall activity remained close to June’s level, there was some variation across regions and application types. Most regions recorded lower submission volumes than a year earlier.
The regional picture
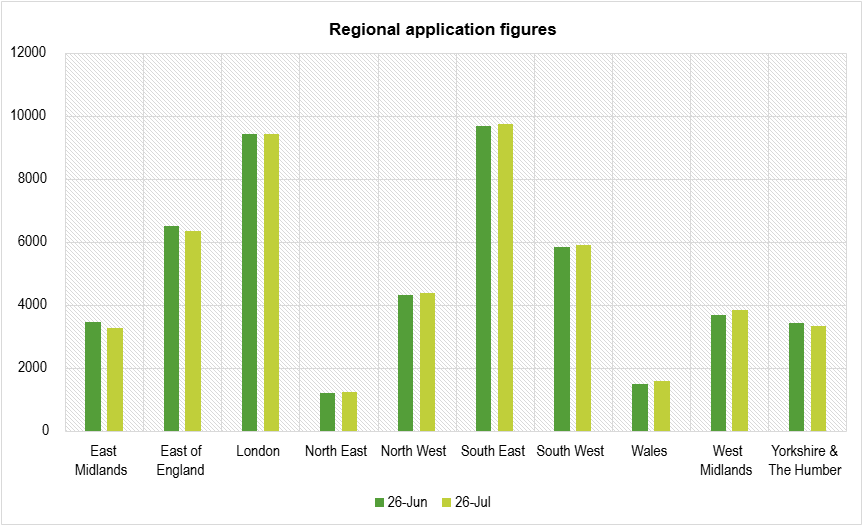
Every region apart from the West Midlands recorded a decrease in applications compared to July 2025, with the North East seeing the largest percentage fall at 8%. The South East saw the largest decrease in application numbers, with 570 fewer applications than in July last year.
Changes were more evenly spread when compared with June 2026. Across the regions, application numbers remained within 200 applications above or below the previous month’s figures. Wales recorded the largest percentage increase, rising by 6%, or 90 applications, while the East Midlands saw the largest fall, decreasing by 5%, or 177 applications.
Looking at the year-to-date figures, total application numbers are 6% below the same period in 2025. Wales has seen the largest percentage decrease, down 18%, while the South East has recorded the largest decrease in application numbers, with 4,768 fewer applications.
The West Midlands, meanwhile, has remained closest to last year’s levels, recording the smallest decrease at 1%, equivalent to 358 fewer applications.
Householder applications
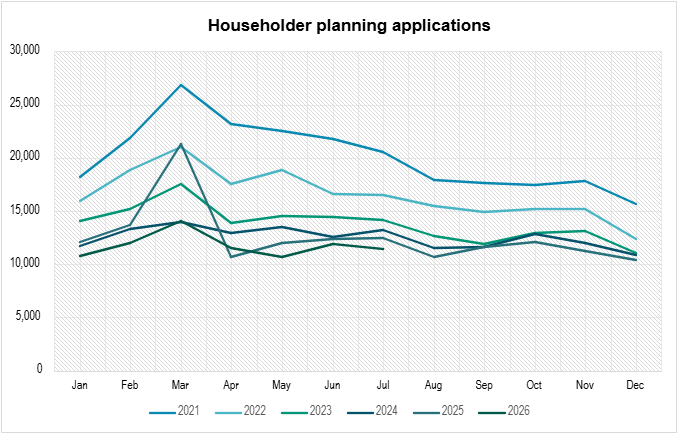
Householder application activity also moved downwards in July. Submissions were 8% lower than in July 2025 and 4% below June 2026.
Within this category, applications for commercial to dwellinghouses fell by 21% compared to the same month last year.
Applications for larger home extensions also declined, falling 10% compared to June 2026 and 6% compared to July 2025.
Full planning applications
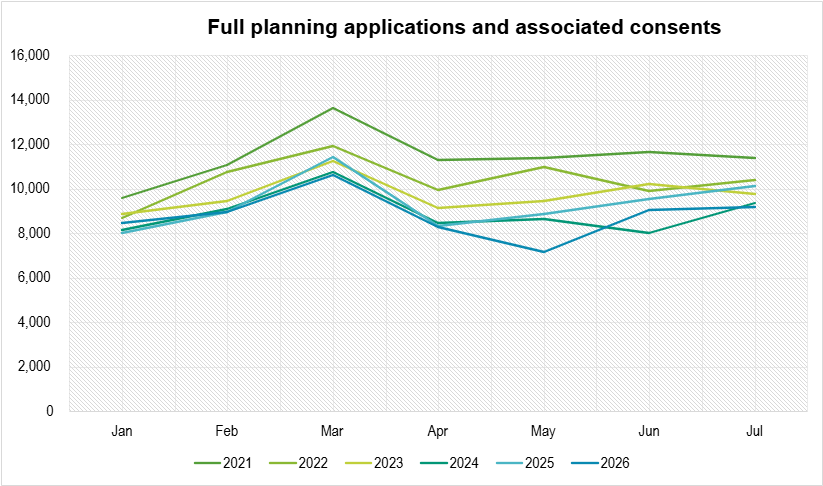
Unlike the overall application figures, both full and outline applications recorded modest increases compared with the previous month.
Full planning applications increased by 1% compared to June 2026, while outline applications rose by 6%.
Despite these month-on-month increases, both remained below the levels recorded in July 2025.
Full applications were down 9% year-on-year, while outline applications decreased by 13%.
Other application types
A mixed picture was also seen across other application types.
In its second month on the system, Permission in Principle received 164 applications in July, up from 118 in June 2026.
Telecommunications applications increased by more than 50% compared to July 2025. However, solar prior approvals moved in the opposite direction, decreasing by 26% compared to the same month last year.
What do July’s figures tell us?
July’s figures show a mixed picture across planning application activity. While overall application numbers remained close to the previous month’s level, activity across individual regions and application types varied.
The month also saw contrasting trends across different types of applications. Householder applications and larger home extensions declined, while full and outline applications recorded modest increases compared to June.
With overall application numbers remaining below July 2025 levels, the data continues to show a different picture depending on the type of application and timeframe being considered.
Forthcoming Market Insight Reports will continue to track how planning application trends develop over the coming months.


