The regional view: a seasonal dip in application numbers
The September Planning Market Insight Report has revealed that from April to July, the monthly total number of planning application submissions remained consistent but with varying percentage increases across the regions. However, the change from July to August has seen most regions experience a double-figure seasonal decline, with the exception of the South West, which is the only region down by a single figure – just 6%.
This can be seen on the map below.
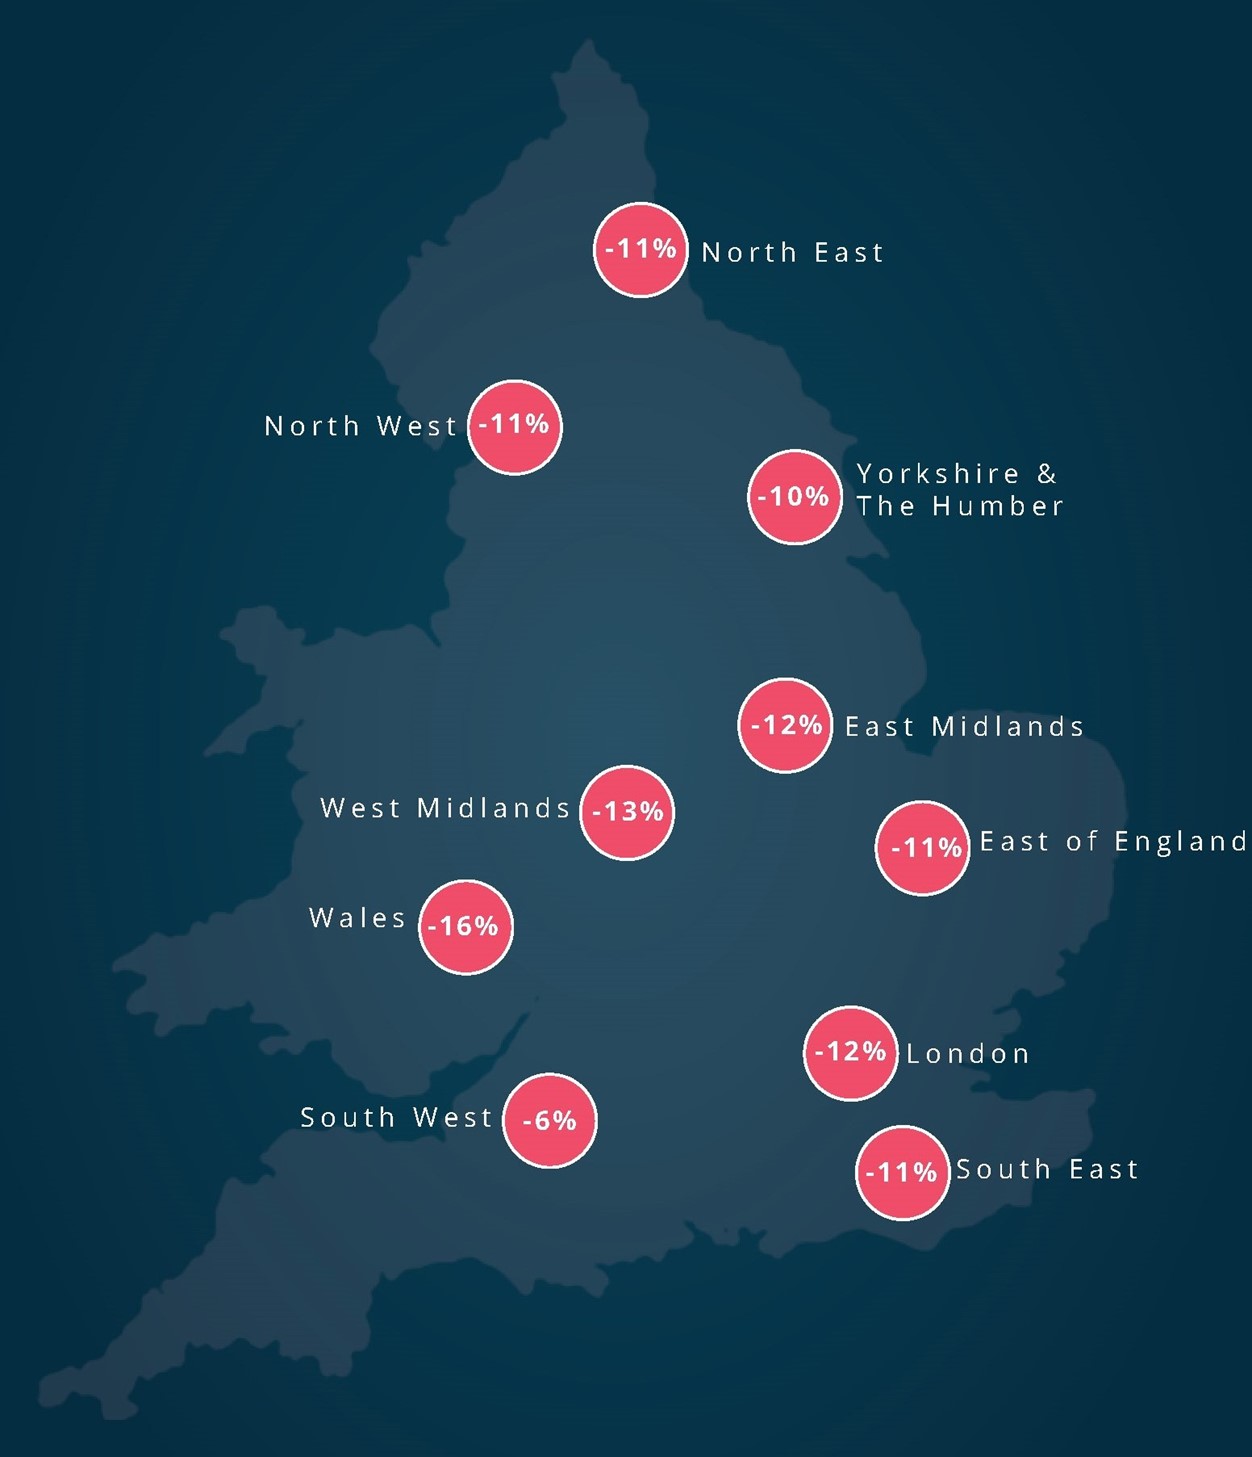
Wales saw the largest percentage decline, down 16% on July, which equates to a drop of 377 applications. In terms of the English regions, the West Midlands noticed the largest decline, down 13% (a fall of 570 applications), followed by 12% in East Midlands and London. However, when looking at the decline by number of applications it is London and South East with the highest figures: down 1,479 and 1,429 applications respectively.
When looking at how August 2021 compares to 2020, all regions including Wales have a positive percentage increase. This highlights the overall increase in submissions month on month between 2021 and 2020. The regions with the largest increase are the South West and East Midlands with 10%, and the lowest being Wales with 2%.
The detail can be seen in the bar chart below which demonstrates the volume submitted in each region of England and in Wales in August 2020 and 2021.

This analysis is part of the Planning Portal Planning Market Insight Report. The Planning Market Insight Report is the earliest source of planning market data available, and each issue features key high-level statistics as well as deeper analysis of a specific sector or topic. You can access the full report here, or sign up to receive it directly to your inbox each month.
