Planning applications in June: the regional view
The rise in applications this June as compared to June 2020 was felt in every region in England and Wales. Overall, applications were 17 per cent higher than last year, but though every region saw an increase, the extent of this varied across the country.
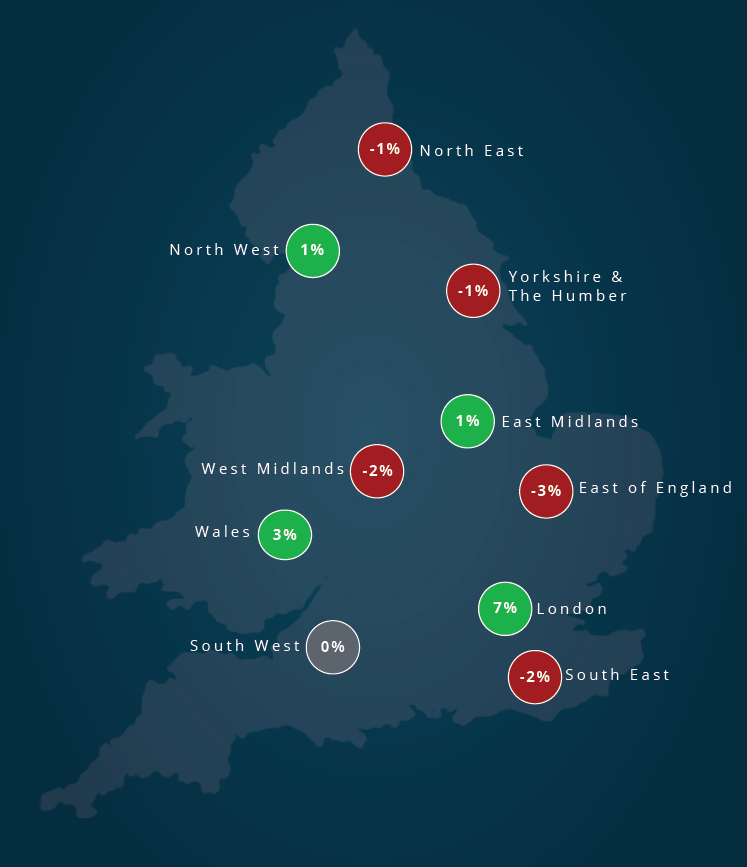
The North East continued to see the strongest recovery in percentage terms, 26 per cent higher this June than last, closely followed by London and Wales where volumes were 24 per cent higher.
Those regions performing below the baseline increase of 17 per cent were the West Midlands (11 per cent), Yorkshire and the Humber (12 per cent), the South West and North West (both 14 per cent). The map shows the percentage change in applications by region from May 2021 to June 2021.
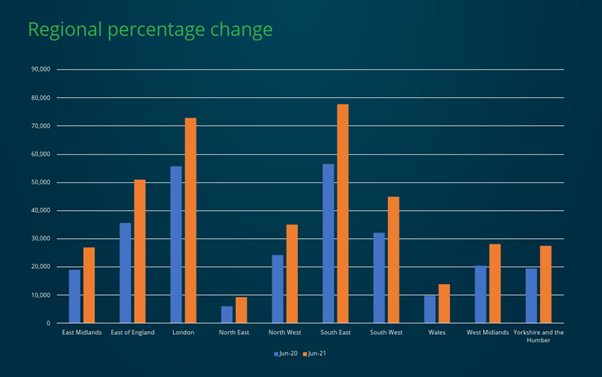
Whilst the percentages vary slightly across the country, it is also worth noting that the volumes submitted in each region vary greatly – from nearly 13,000 applications in June in both London and the South East, to as few as 1,500 in the North East. The detail can be seen in the bar chart below, which demonstrates the volume submitted in each region of England and in Wales in June 2020 and June 2021.
This analysis is part of the Planning Portal Planning Market Insight Report. The Planning Market Insight Report is the earliest source of planning market data available, and each issue features key high-level statistics as well as deeper analysis of a specific sector or topic. You can access the full report here; to get the first look at the planning data processed in July, register to get the monthly update sent directly to your inbox.
