The regional view: recognisable patterns return
Our latest Planning Market Insight Report has revealed that seasonal patterns in planning applications appear to be settling back into their usual trends, albeit we are still seeing higher numbers of submissions than is typical.
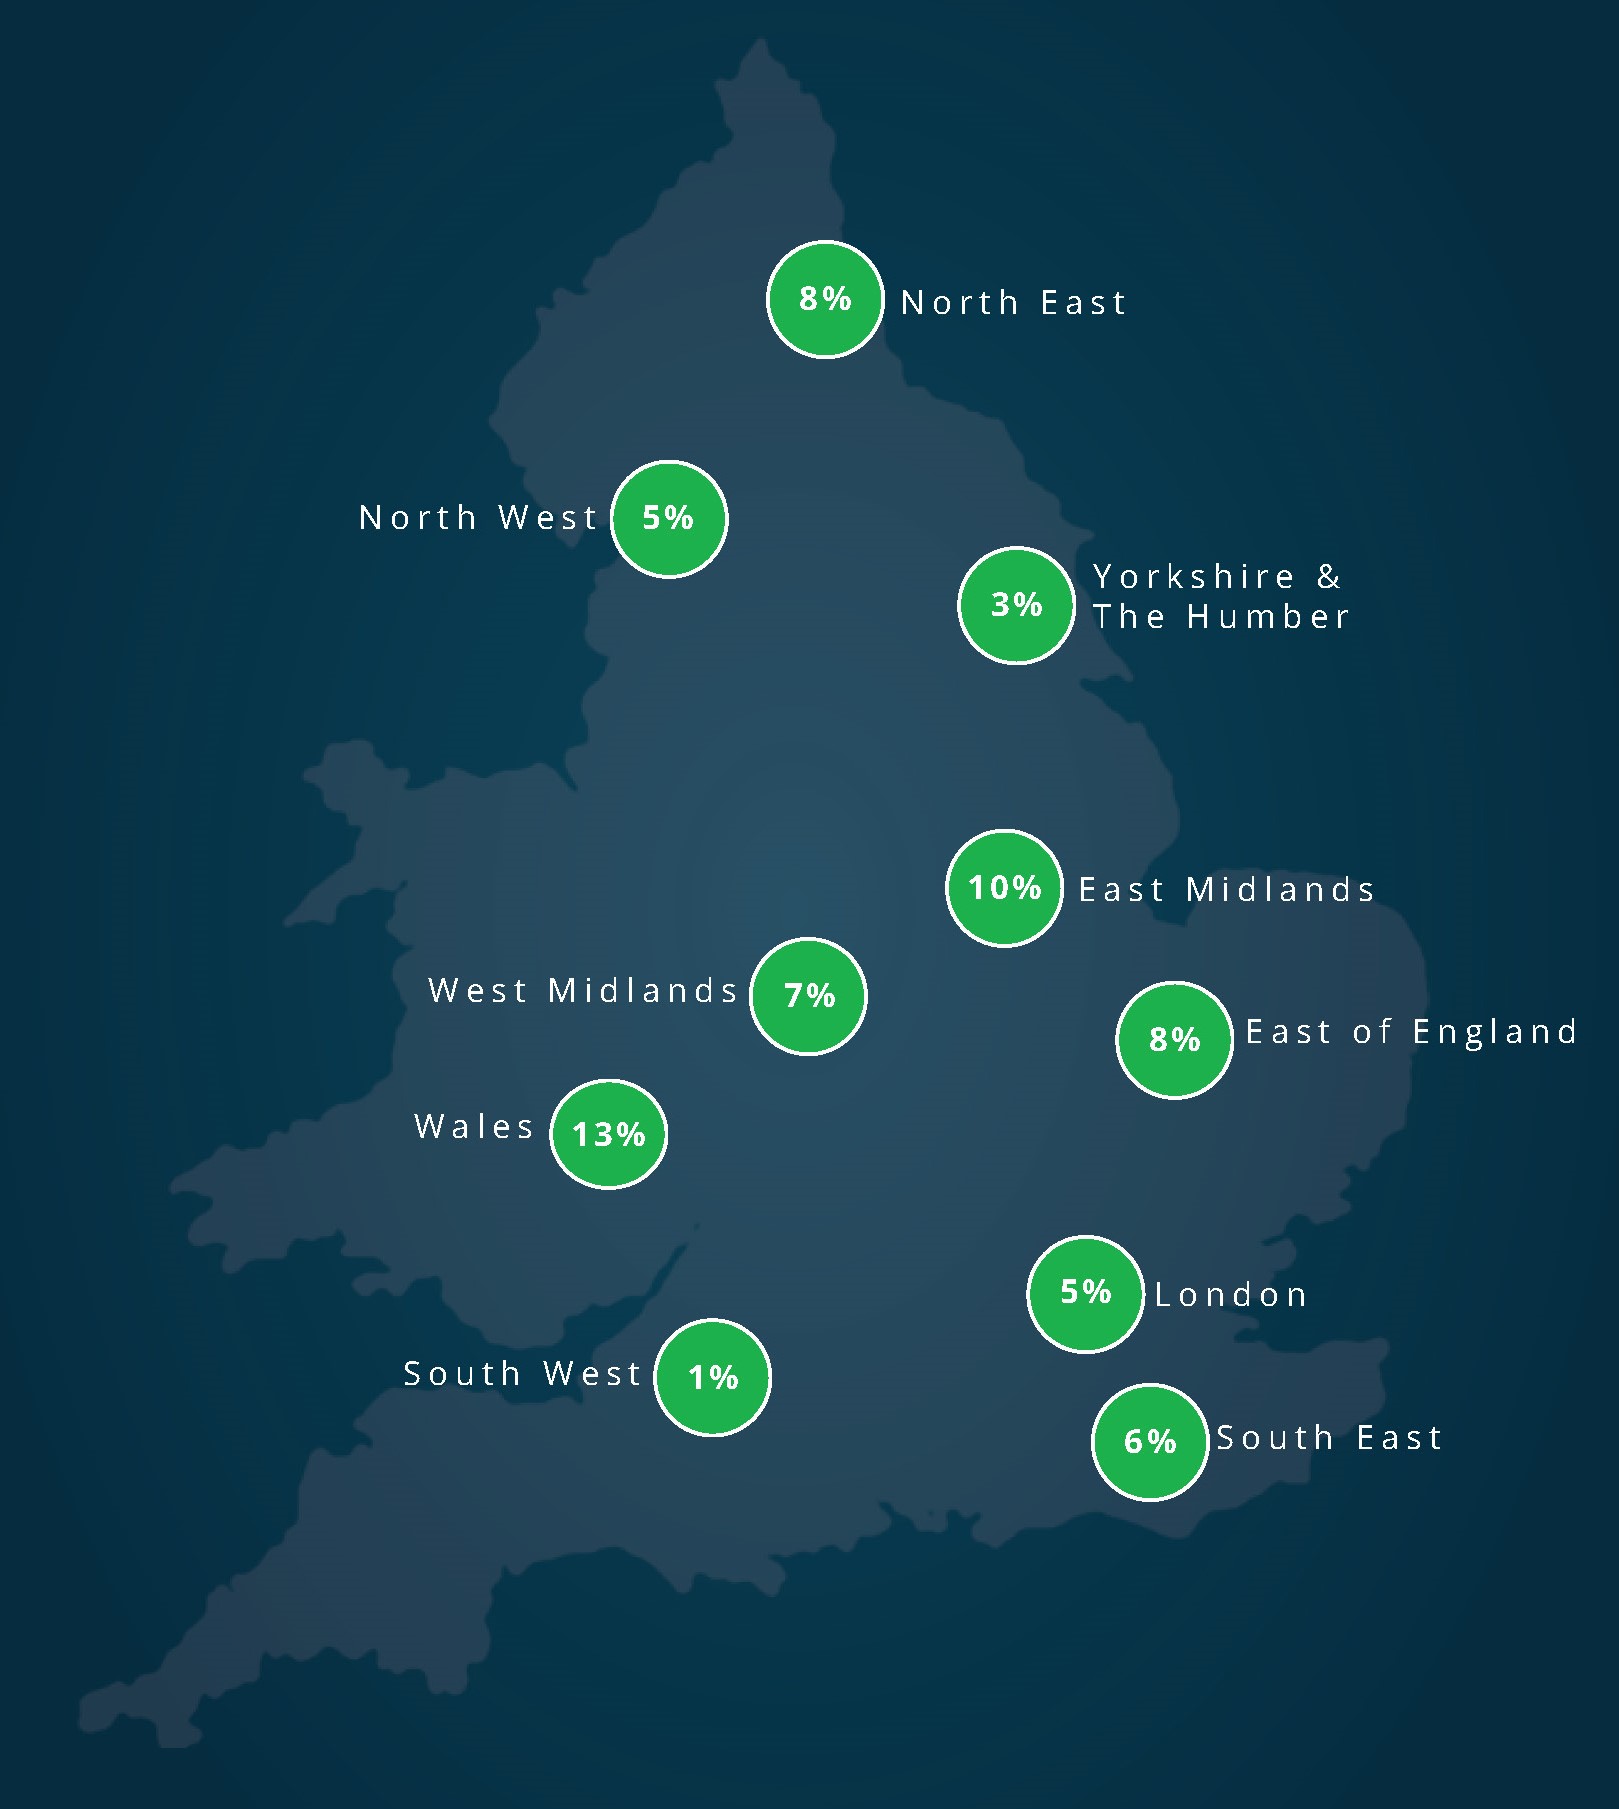
Last month, planning application numbers rose in every English region and in Wales as compared to July 2020. Overall, applications were six per cent higher than last year, but though every region saw an increase, the extent of this varied across the country, ranging from one per cent to 13 per cent.
Wales saw the highest percentage increase in application numbers, up 13 per cent year-on-year, though the actual numbers were quite small, rising from 2,102 in July 2020 to 2,382 in July 2021. The East Midlands (ten per cent), the East of England (eight per cent), the North East (eight per cent) and West Midlands (seven per cent) also outperformed the national average.
The two regions which typically receive the highest number of applications are London and the South East, who between them received 24,772 applications last month, a collective increase of 1,310 compared to July 2020. They both saw an increase around the national average at five per cent and six per cent respectively.
The smallest rises in terms of percentages were recorded in the South West at just one per cent (83 applications) higher than last year, and Yorkshire and the Humber which was three per cent (128 applications) up.
The figures can be seen in the map below, which indicates the percentage change in volumes submitted in each region of England and in Wales in July 2021 as compared to July 2020.
This analysis is part of the Planning Portal Planning Market Insight Report. The Planning Market Insight Report is the earliest source of planning market data available, and each issue features key high-level statistics as well as deeper analysis of a specific sector or topic. You can access the full report here, or sign up to receive it directly to your inbox each month.
