January 2026 – Market Insight

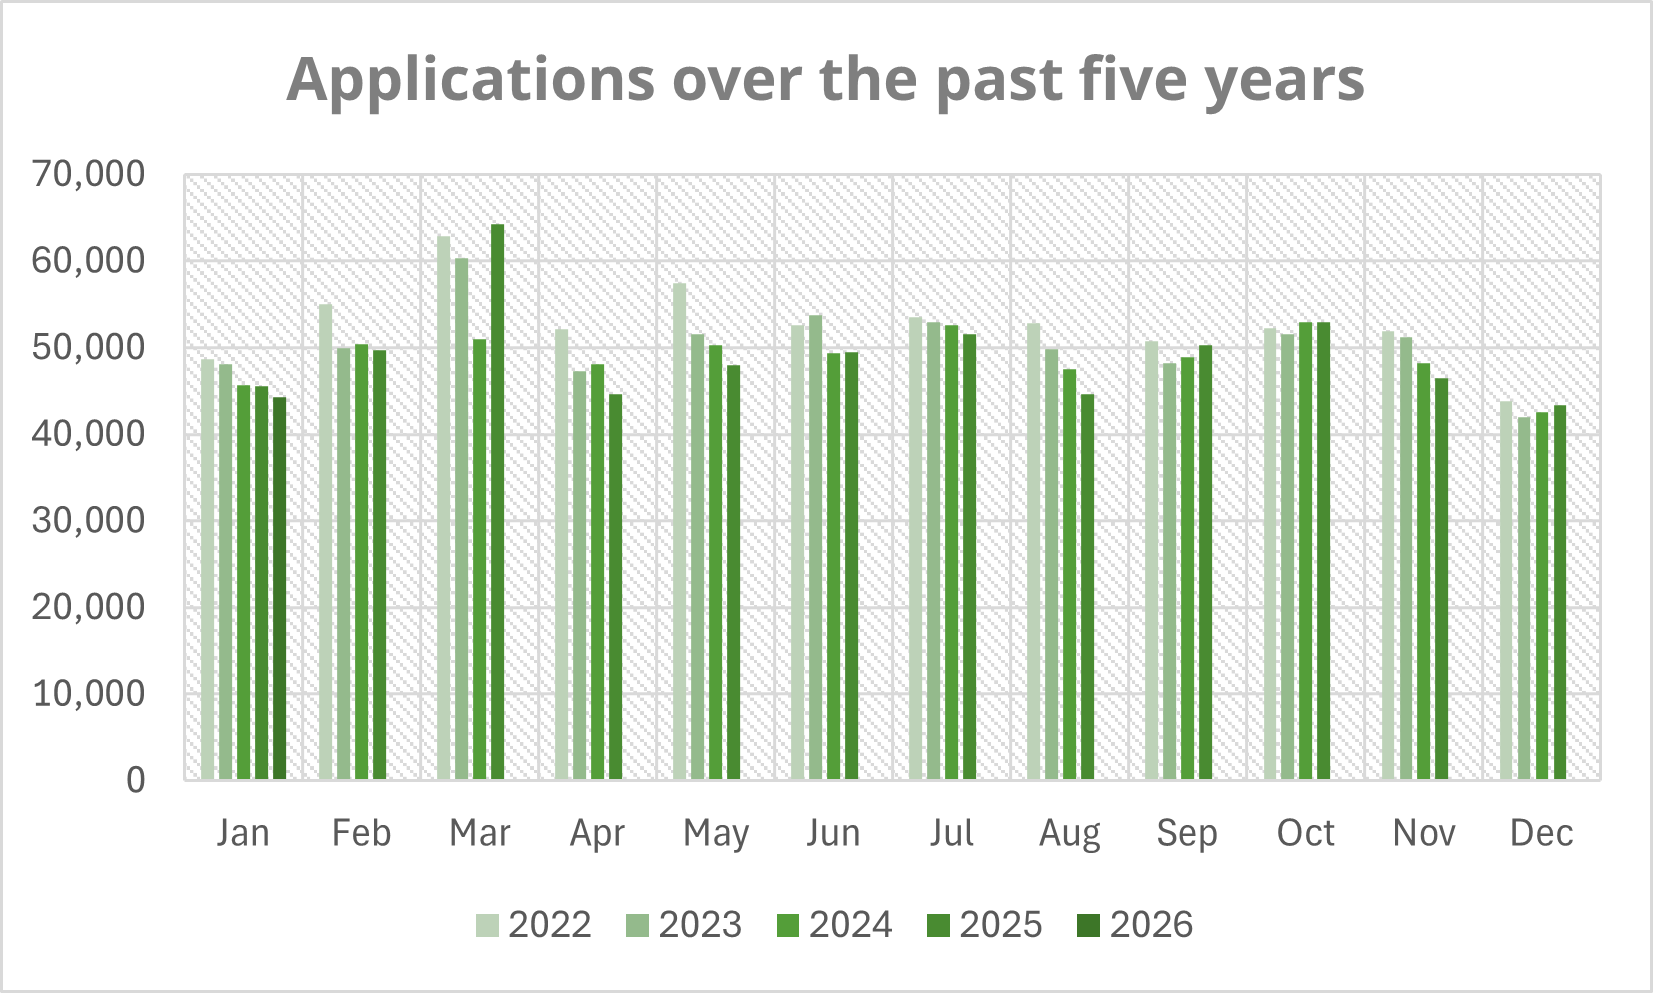
2026 has begun on a solid footing for planning activity. In January, 44,262 applications were submitted – 2% higher than December’s total, and just 3% below January 2025.
The regional picture
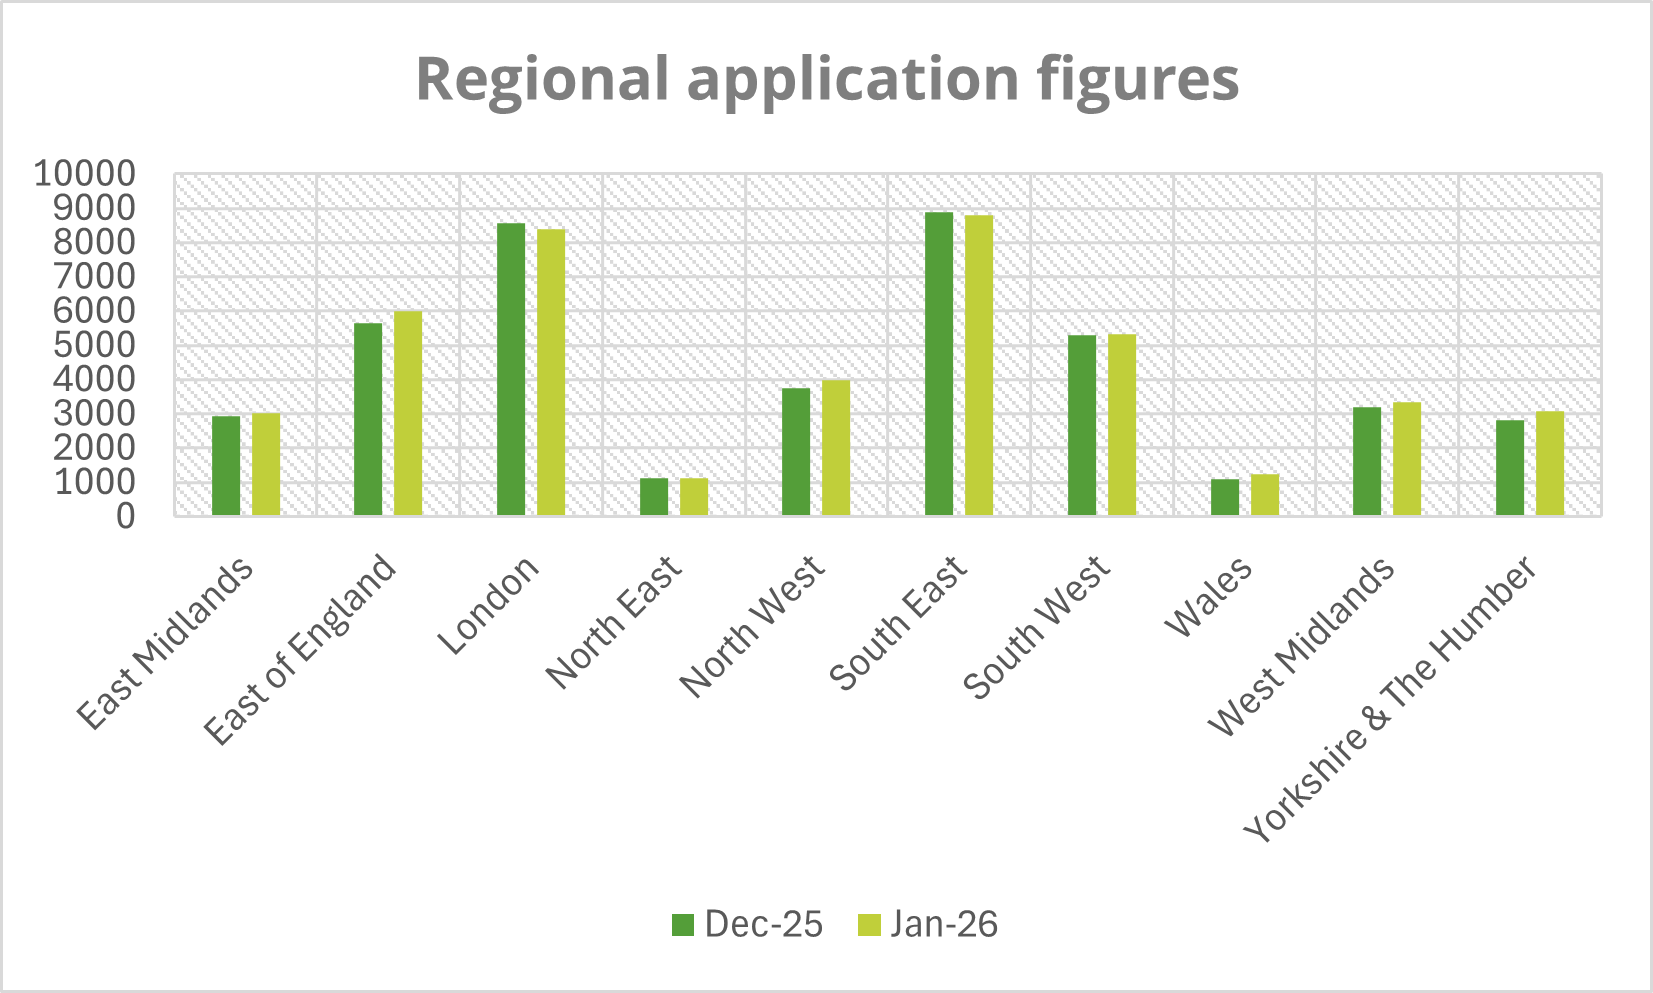
Regionally, performance was mixed. Compared to January last year, every region recorded a decline in application numbers with the exception of the North West, which saw a 6% increase. Wales experienced the sharpest annual drop, with applications down 29% year-on-year.
On a monthly basis, most regions saw growth compared to December. The only exceptions were the South East (-1%) and London (-2%). Wales recorded the strongest month-on-month uplift, with applications increasing by 14% compared to December, suggesting a notable rebound following earlier declines.
Householder applications
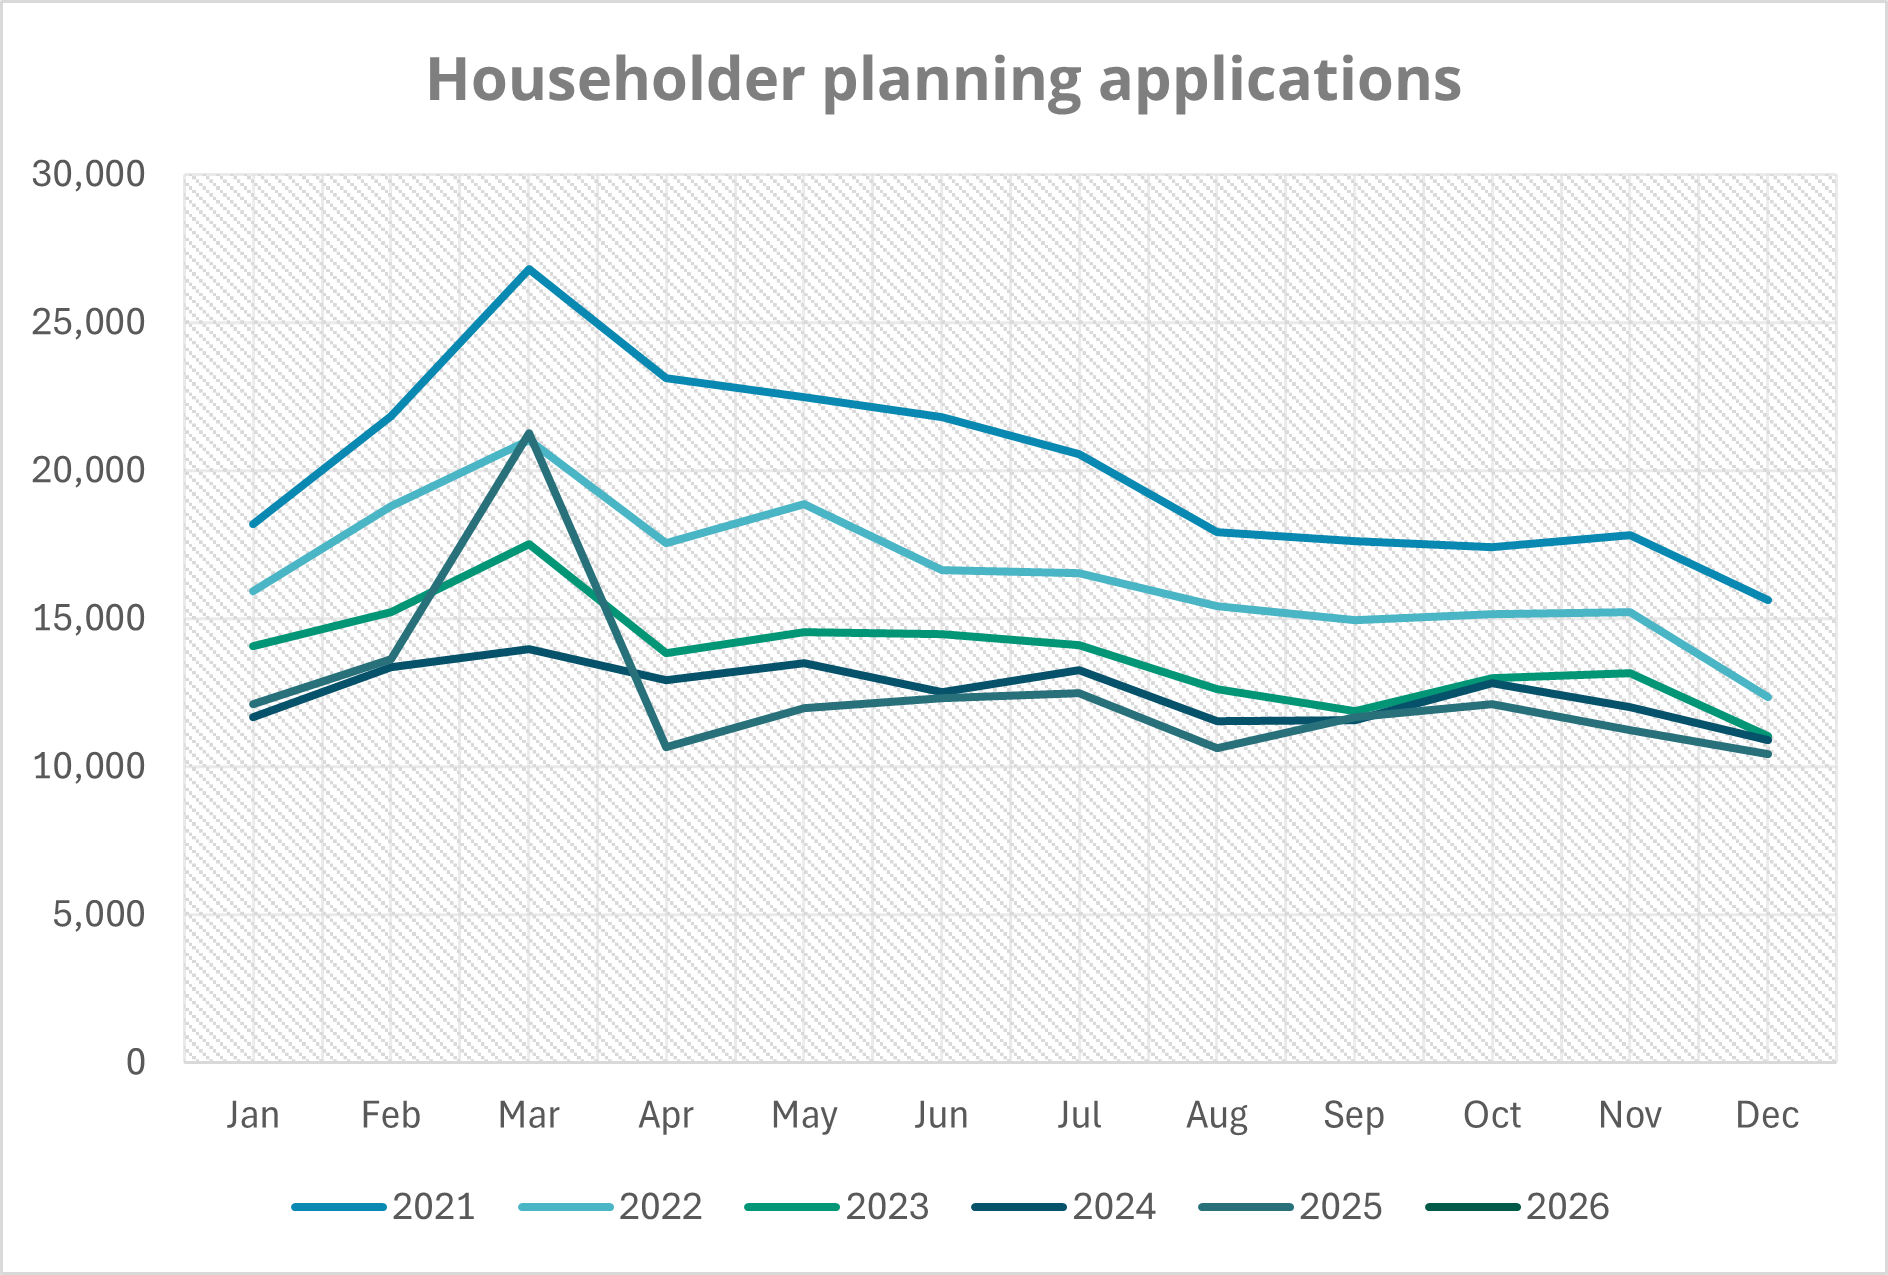
Householder applications fell 11% year-on-year compared with January 2025, though they rose 4% month-on-month against December. Within this category, applications for larger home extensions were also down 11% on the same month last year.
It is likely that submission patterns in Q1 2025 were influenced by government’s fee increase, introduced in April 2025, which disproportionately affected householder applications.
Full applications
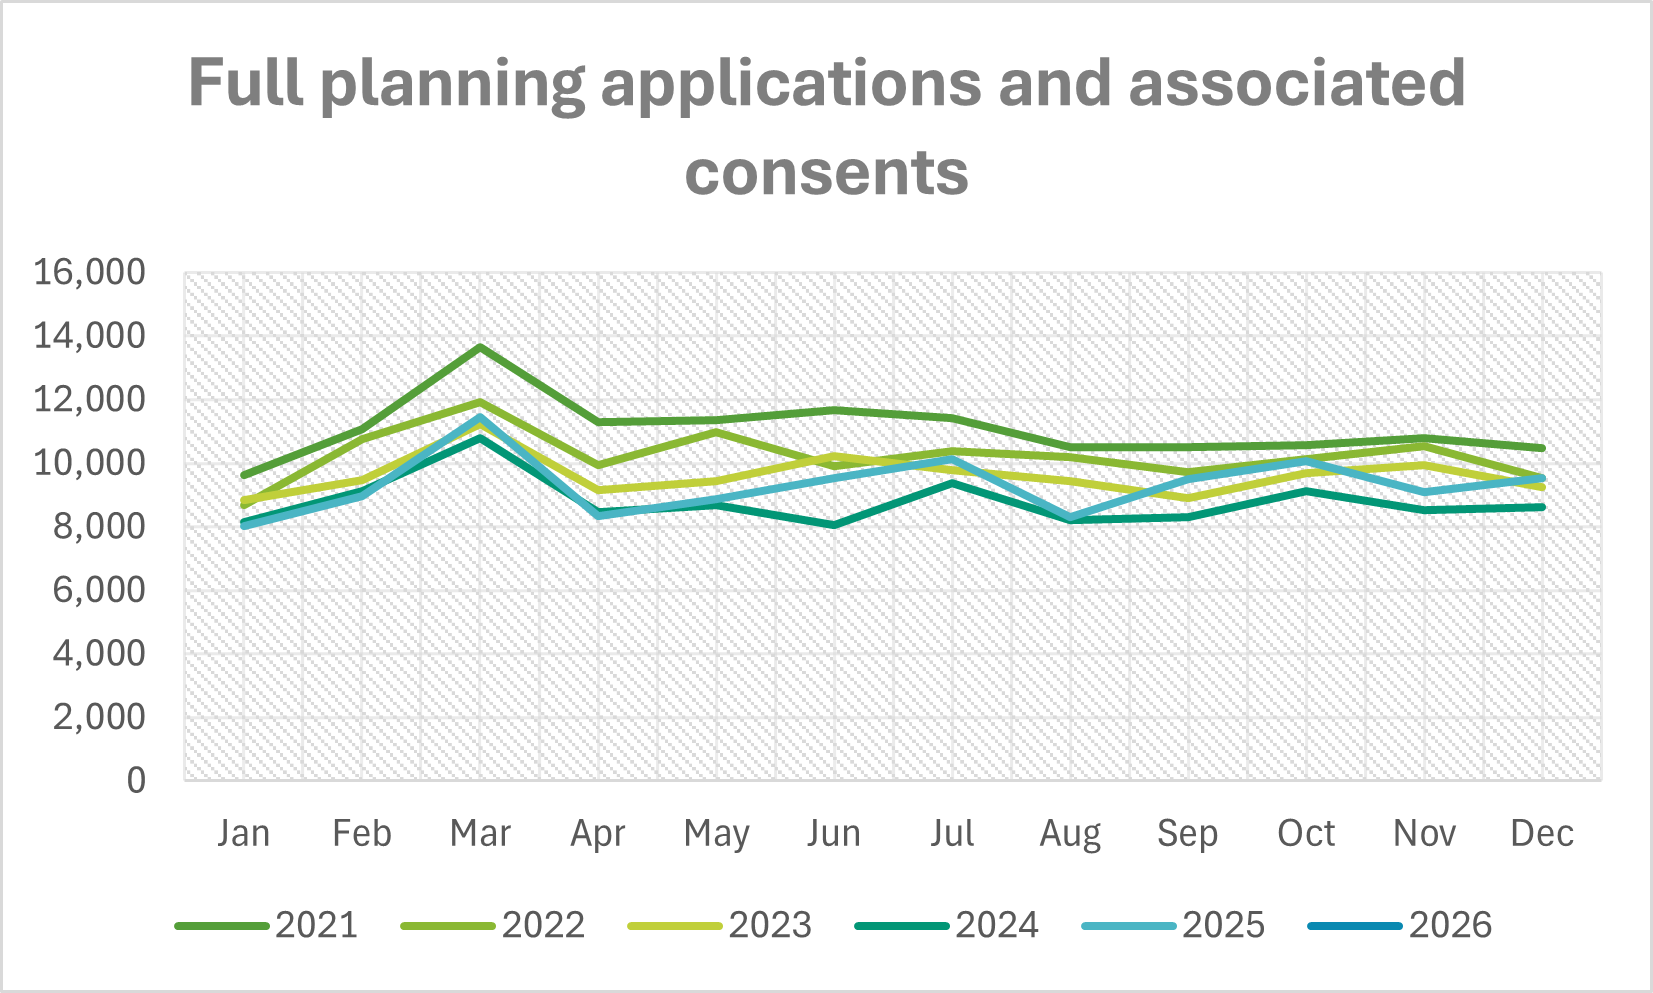
In contrast to householder trends, full planning applications fell 11% compared with December 2025 but rose 5% year-on-year against January 2025. While the month-on-month dip reflects the usual seasonal slowdown following the year-end, the increase against last January suggests a stronger start to 2026 for full applications.
Outline applications performed particularly strongly in January 2026, increasing 12% compared with January the previous year. This notable uplift may indicate growing confidence in longer-term development pipelines as we move further into 2026 – a finding echoed in recent editions of our Planning Application Index series, which looks at new housing delivery.
While January 2026 recorded slightly fewer applications than the same month last year, it’s important to recognise that Q1 2025 experienced an unusual surge ahead of the government’s planning fee increase, which came into effect on 1 April 2025. This particularly impacted householder applications.
Viewed in that context, the current year-on-year dip reflects market normalisation rather than decline. Meanwhile, month-on-month growth points to underlying resilience, suggesting we may continue to see steady momentum as 2026 progresses.
