July’s Market Insight Report is now available

In July 2025, a total of 51,508 planning applications were submitted – a 2% increase on both July 2024 and July 2023. This continues the upward trend highlighted in our recent Market Index, with application volumes generally higher than in previous years.
Month-on-month growth was also recorded in July, with 2,000 more applications submitted compared with June.
Regionally, all areas except Wales, London, and the West Midlands saw increases compared to the same month in 2024. The East of England reported the largest growth, while Wales experienced a 5% decline.
When comparing July to June 2025, all regions saw increases, with the North East showing the strongest uplift at 11% (an additional 129 applications).

Year to date
Across 2025 to date, planning applications have risen in almost all regions, with Wales the only outlier, recording a marginal 0.3% decline. The East of England leads the way with a 10% increase (4,256 additional applications), followed closely by Yorkshire and The Humber at 9%. Every English region has recorded growth of at least 5%.

Application types
Different application types showed mixed performance in July 2025:
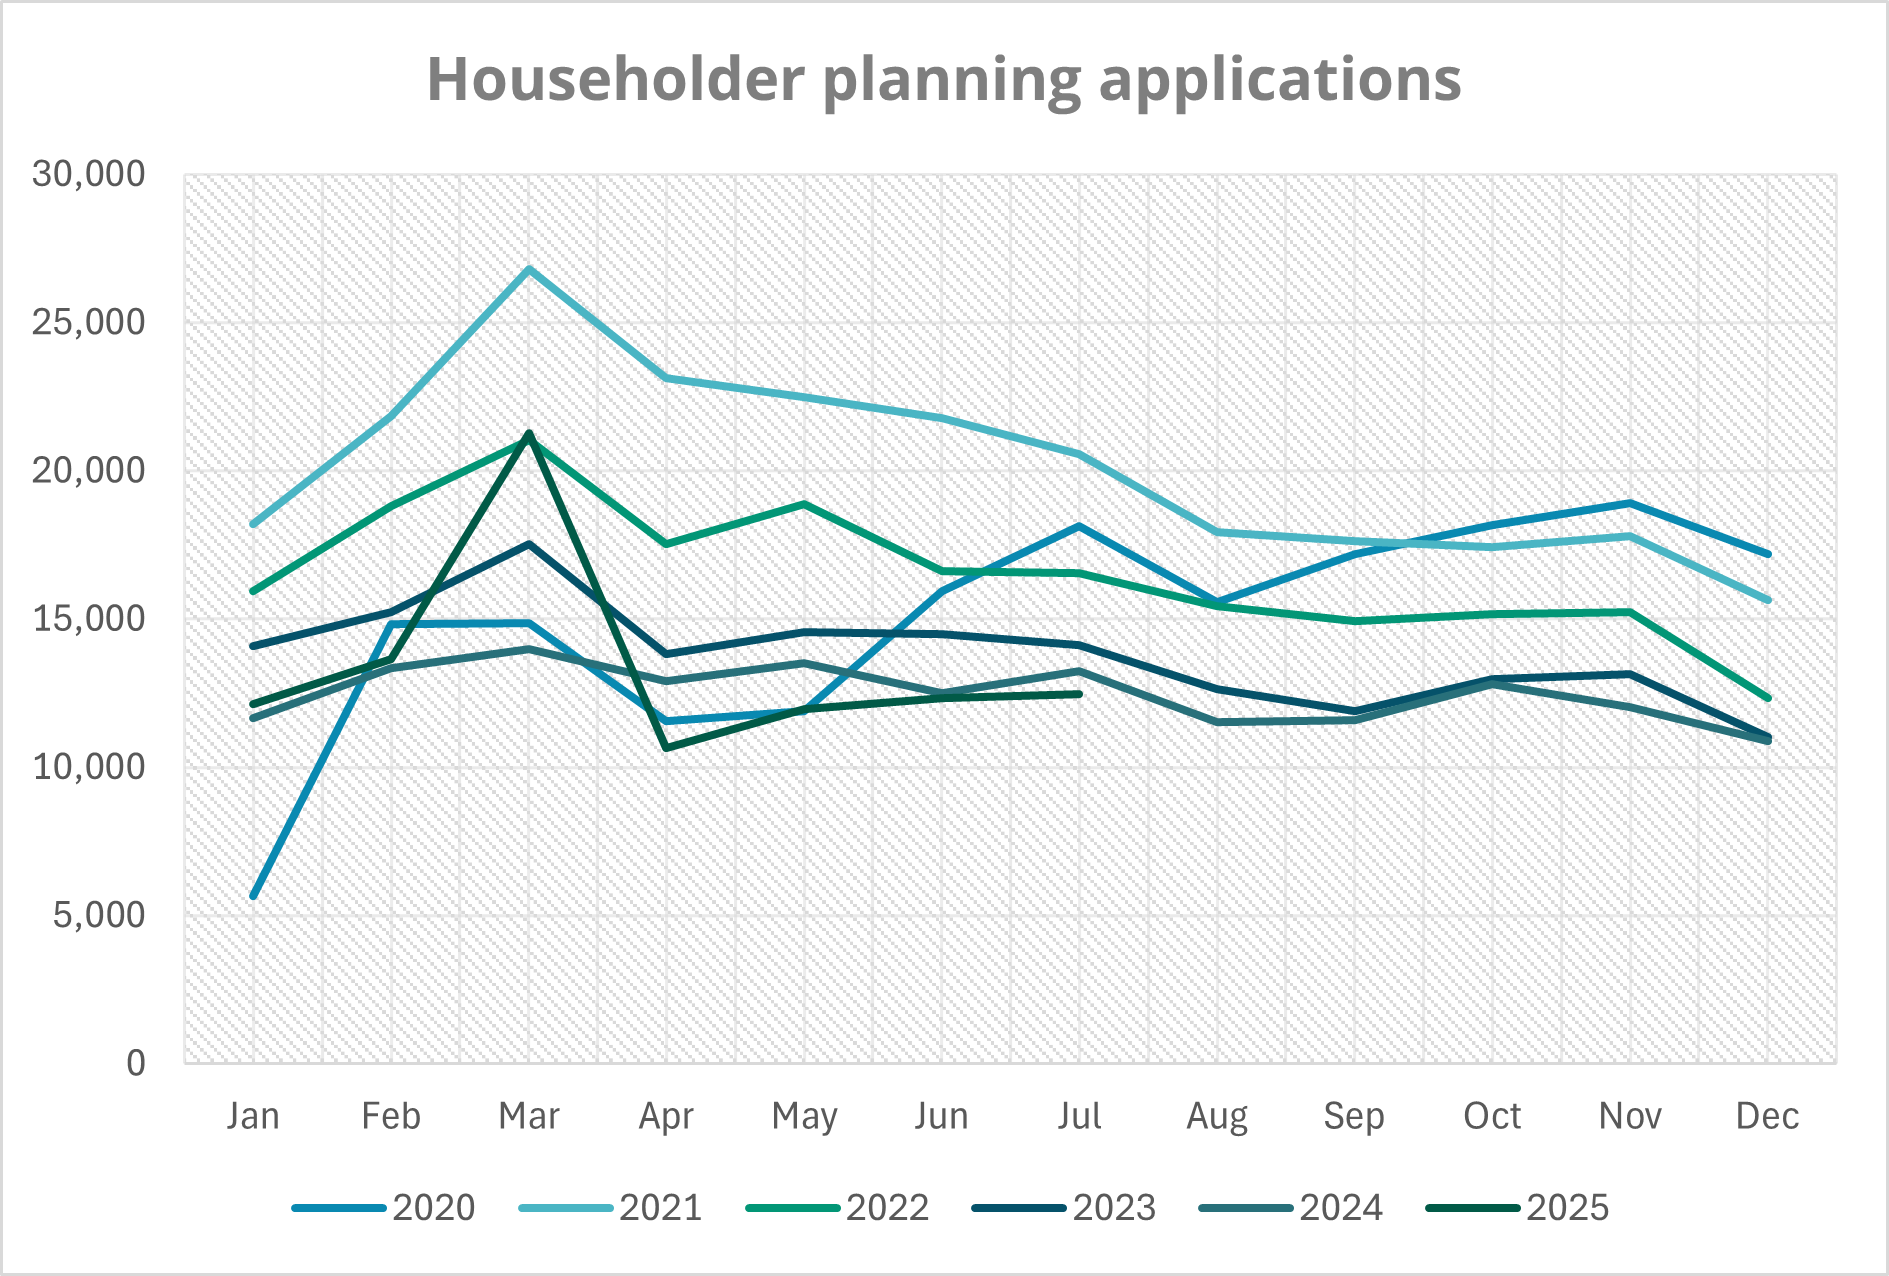
Householder applications fell 6% compared with July 2024, but was up 1% compared to June 2025. Larger home extensions declined by 2% (21 applications) compared with June 2024.
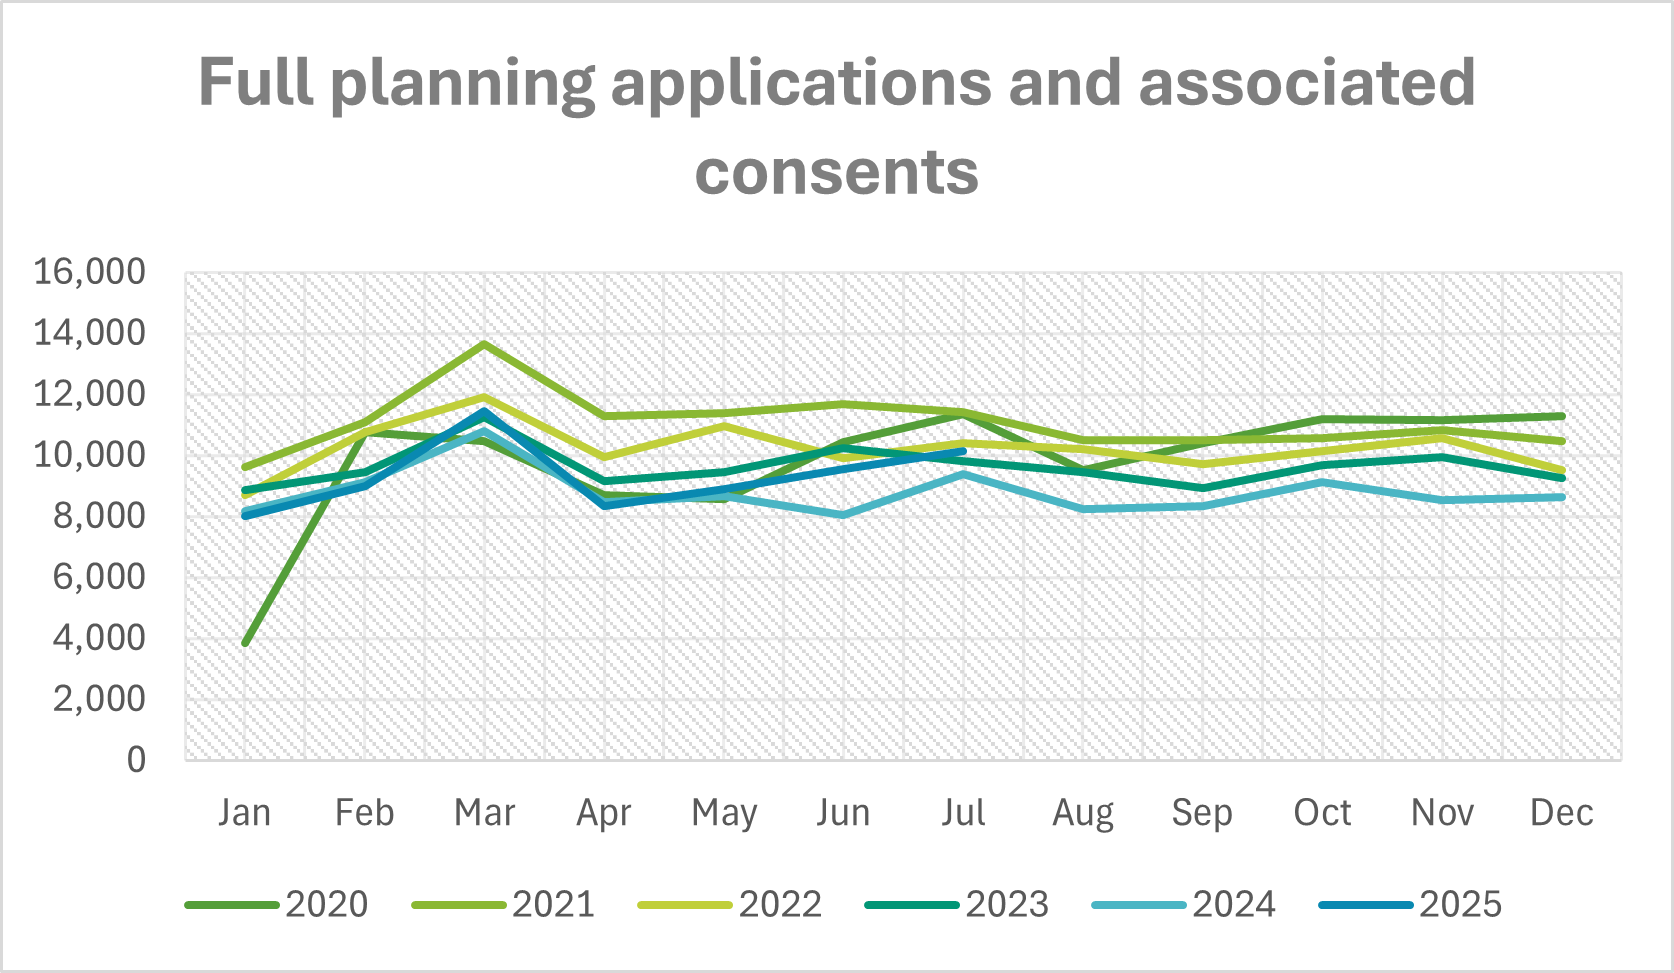
Full applications rose by 6% compared with June 2025 (594 additional applications) and by 8% year-on-year, equating to 749 more applications.
Outline applications performed particularly strongly, up 21% on July 2024, representing 64 additional applications.
Overall, the July figures underline a resilient planning market, with steady growth across most regions and strong performances in key application types. While householder activity remains subdued, the strength of full and outline applications highlights ongoing confidence in larger development projects. With year-to-date volumes ahead of recent years, the outlook for 2025 remains positive despite regional variations.
For a deeper dive into recent planning trends, read our Q2 Planning Application Index, out now.

Comments are closed.