June’s Market Insight Report is now available
June has delivered promising planning application figures, especially when compared to the same period in 2024.
Despite expectations of a slowdown following last quarter’s surge driven by fee increases, the sector has shown remarkable resilience and continued momentum. Far from a slump, the data reveals renewed energy and motivation across the industry – a trend we’ll explore in greater detail in our upcoming index.
The big picture
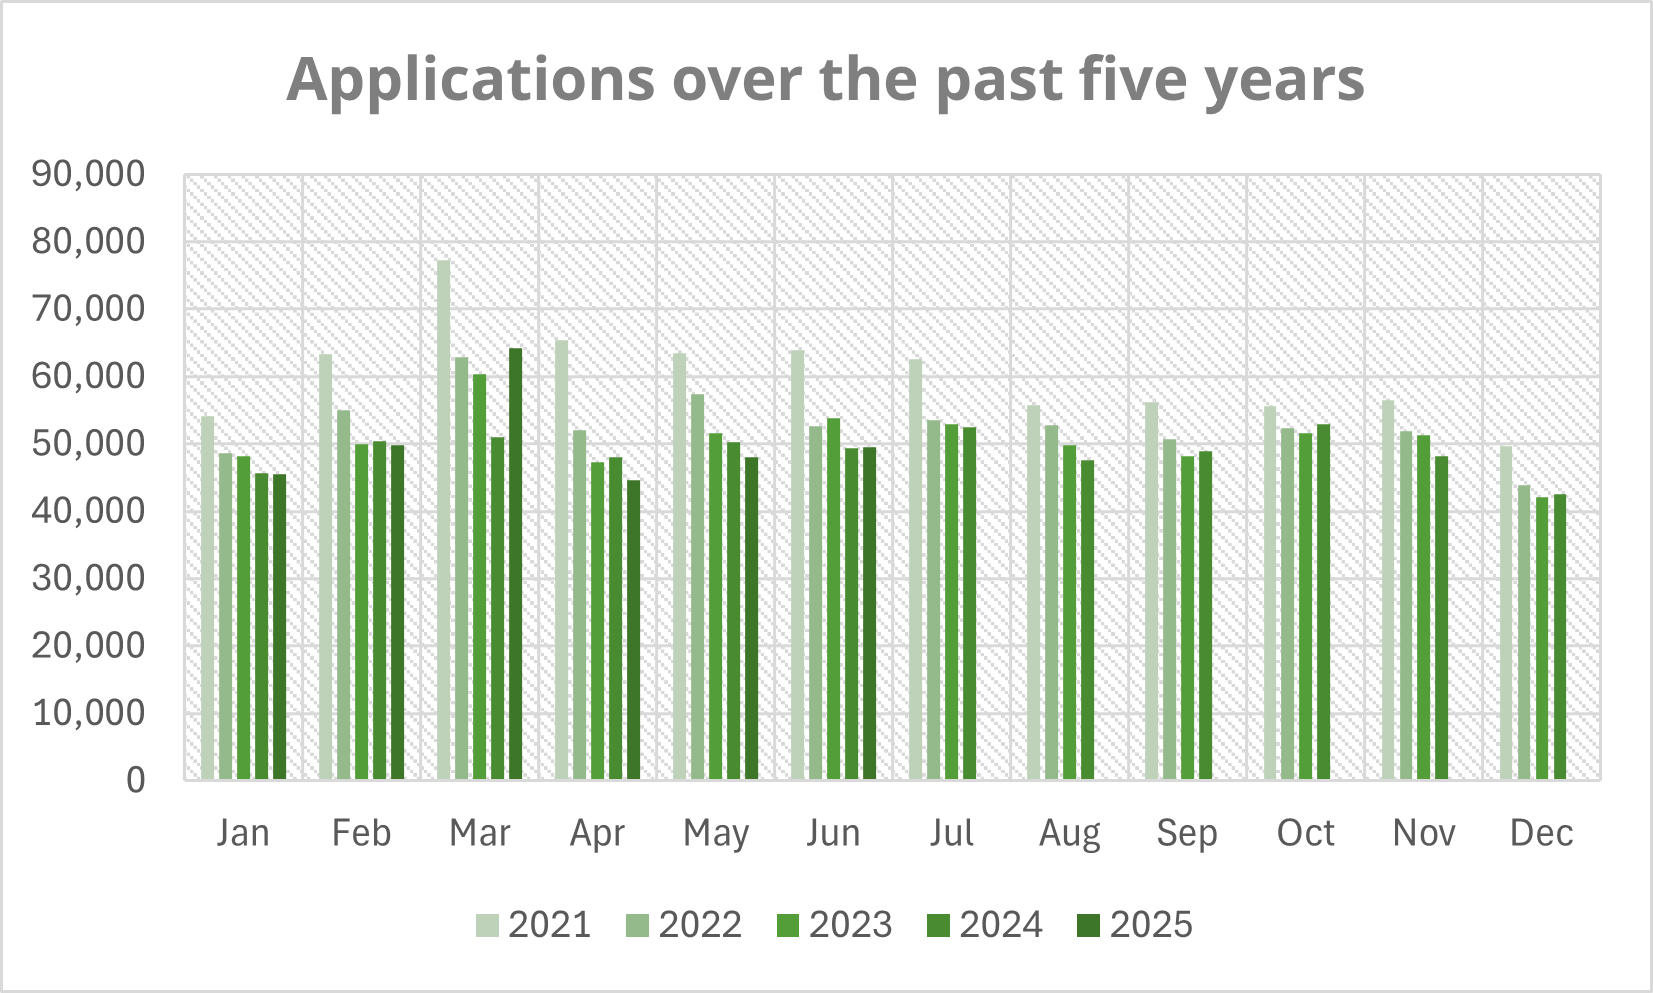
There was a total of 49,511 planning applications submitted via Planning Portal during June 2025, which is a 10% increase when compared with June 2024. June was also up 3% against May of this year, which in real terms means a total of around 1,500 more applications.
Regional and sector highlights
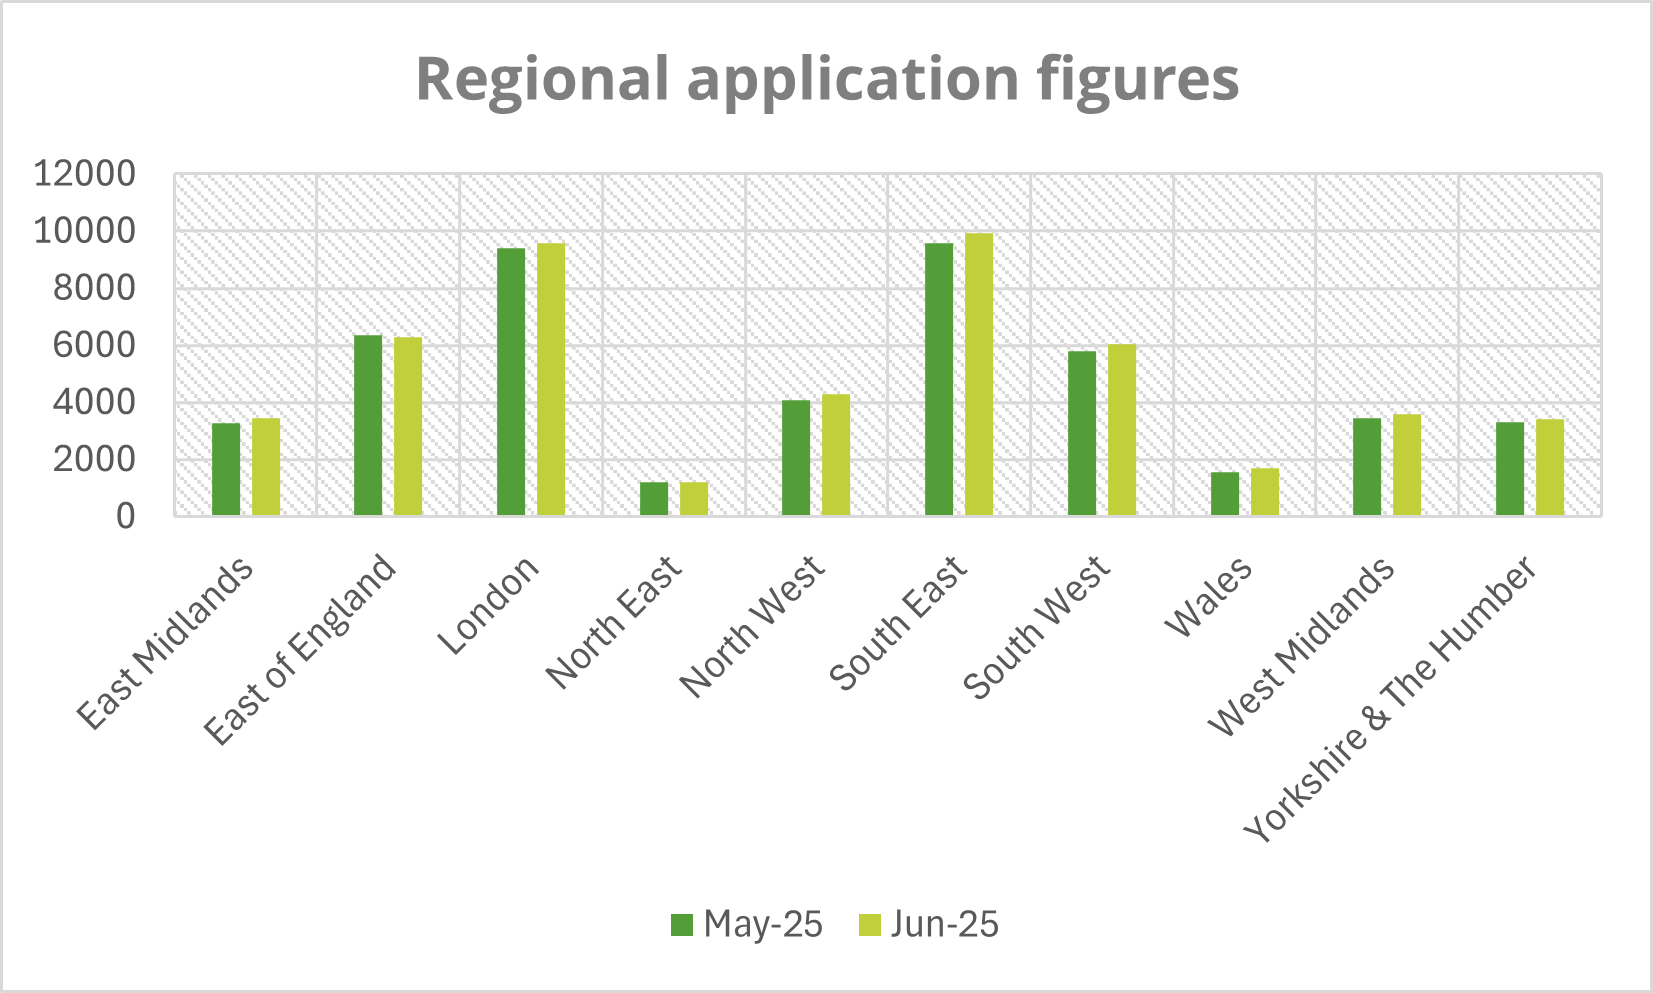
Most regions experienced growth compared to June 2024, with all English regions seeing increases of 6% or more. The East of England and East Midlands led the way, each recording a 15% rise, with the East of England posting the largest volume increase – 820 additional applications compared to the previous year.
Wales was the only region to see a slight decline, down 1% year-on-year, though it still showed strong month-on-month growth of 9%.
Year-to-date figures reinforce this positive trend, with every English region up by at least 6%, and the East of England leading again with a 10% increase, equating to 3,737 more applications since January. Yorkshire and The Humber matched this 10% growth, while Wales remained steady with a 1% increase.
Application types and emerging trends
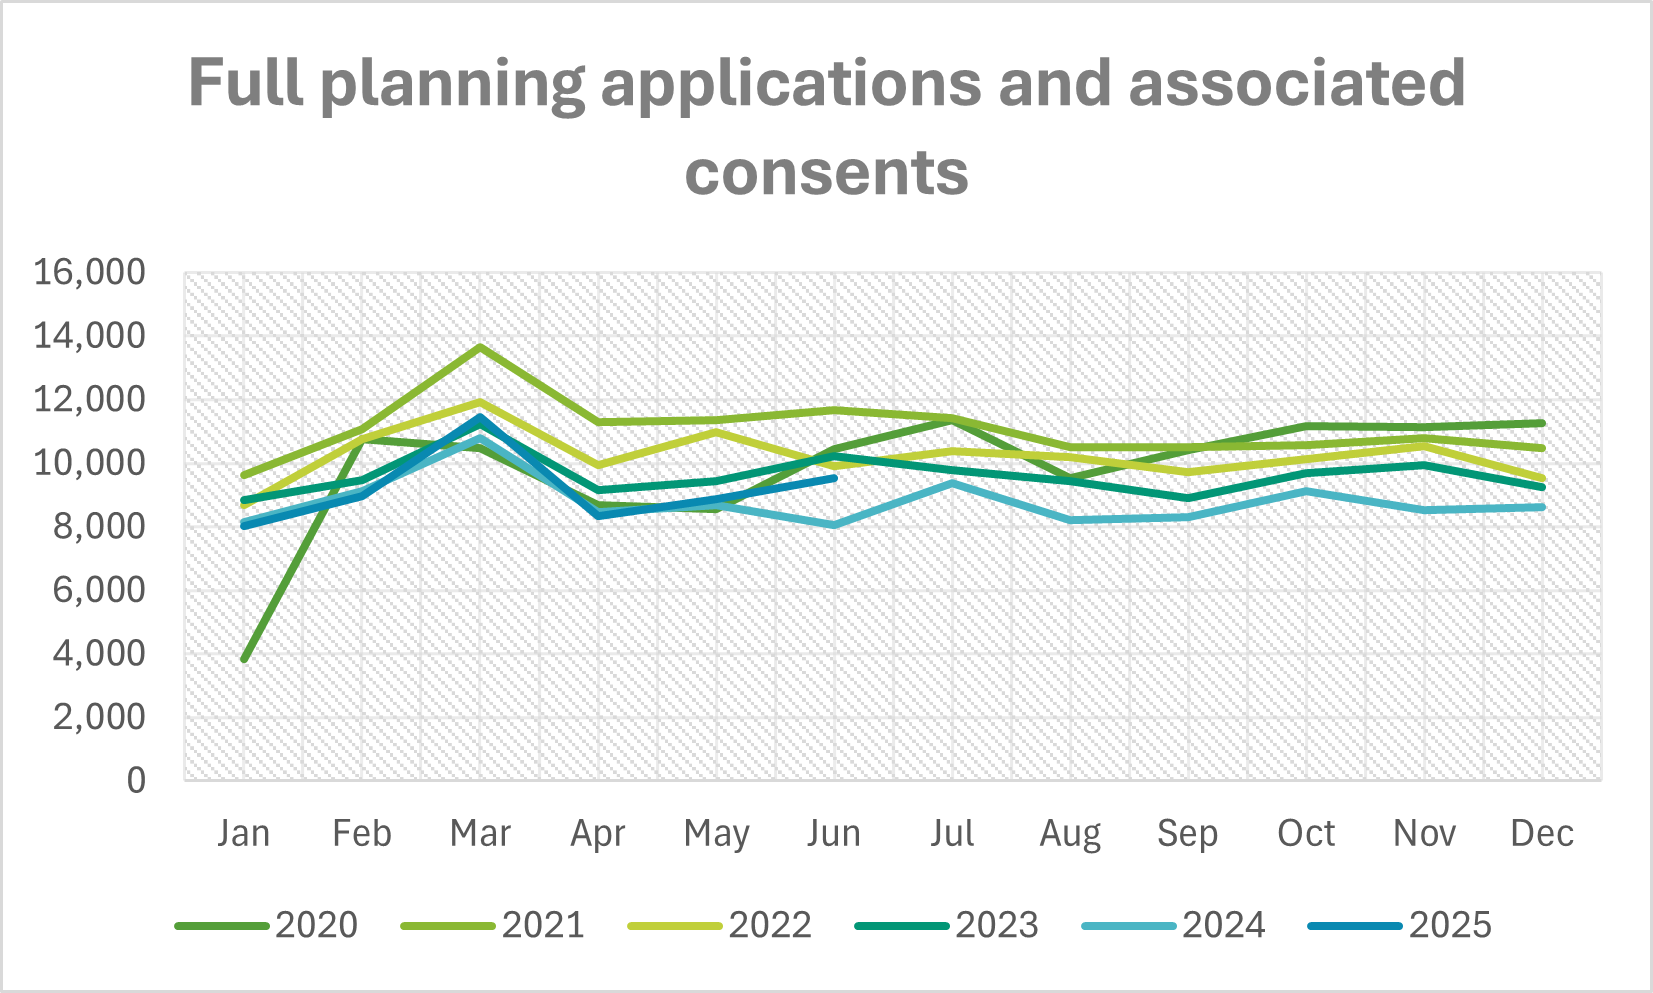
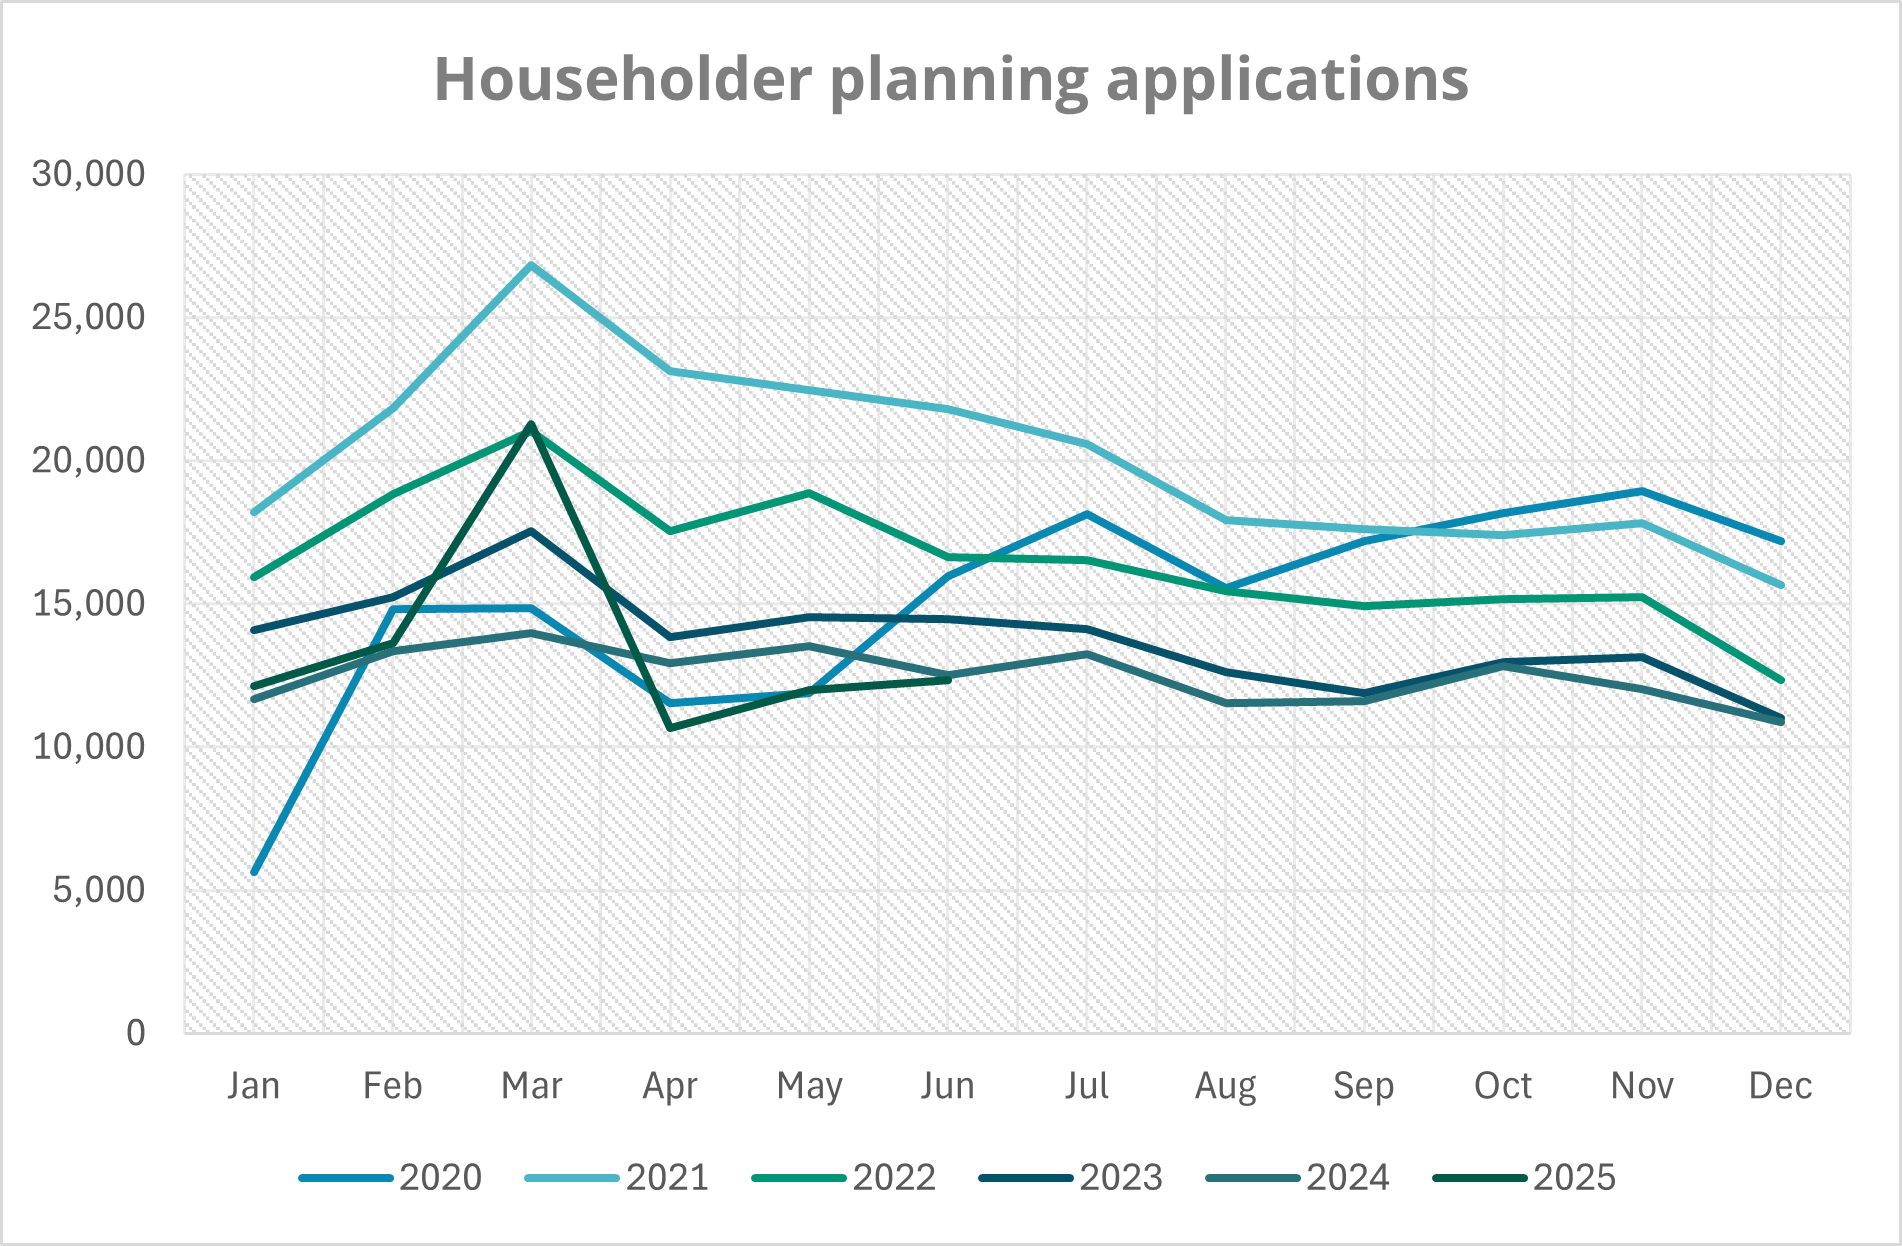
Looking more closely at application types, full planning applications are driving much of this growth, up 19% compared to June 2024, with an increase of nearly 1,500 applications. Outline applications saw an even sharper rise, up 32%, though from a smaller base. Householder applications dipped slightly by 2% year-on-year but still rose 3% compared to May 2025.
Smaller but significant categories are also showing notable growth. Applications for advertisement consent jumped 30%, tree preservation orders increased by 22% (over 1,300 more applications), and change of use applications from commercial to mixed use including flats surged by 72%. Applications for removal or variation of conditions and listed building consents also rose by 21% and 26% respectively.
Telecommunications applications bucked the trend with a small decline of 7% compared to June 2024.
Looking ahead
The latest figures suggest sustained momentum across the planning sector, reflecting both resilience and adaptability in the face of economic pressures and recent fee changes. The growth across a wide range of application types – from major full and outline submissions to more targeted consents – points to a complex yet highly active planning landscape.
These early signals are encouraging, and our upcoming Q2 index will explore them in greater depth. The report will provide detailed analysis, expert commentary, and focused insight into some of the sector’s most pressing challenges – not least the urgent need to accelerate housing delivery at scale.
As the national planning application service, we’re uniquely positioned to offer early visibility into trends shaping the market. Each month, we publish high-level data to help stakeholders track activity and anticipate shifts in demand. Our quarterly index goes further – offering a deeper, data-led view of sector dynamics.

Comments are closed.