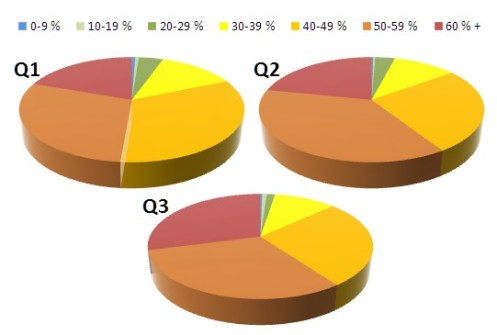
LPA online application percentages (2011) – Updated
The following group of local authorities have all averaged more than 60% of their planning applications online throughout quarters 1-3, 2011, 22 of them have averaged greater than 70%. A fantastic performance I hope you’ll agree.
Particular mention should go to Melton who have risen from 52.1% to 78.5% online and Stevenage from 43.6% to 68.8%.
| Ealing Council London Borough | 88.0% |
| Craven | 86.7% |
| Brecon Beacons NPA (Powys NP) | 85.5% |
| London Borough of Hackney | 85.4% |
| Hinckley and Bosworth | 84.1% |
| Hammersmith and Fulham London Borough | 81.7% |
| Oadby and Wigston | 80.1% |
| Coventry | 74.6% |
| Charnwood | 74.4% |
| Merton Council LB | 74.1% |
| Lambeth Council LB | 73.6% |
| Westminster City Council | 72.3% |
| Preston | 72.1% |
| Bristol UA | 71.8% |
| Bedford Borough Council | 71.6% |
| King’s Lynn and West Norfolk | 71.1% |
| Tower Hamlets LB | 71.1% |
| Stoke on Trent UA | 70.7% |
| Royal Borough of Kensington and Chelsea | 70.6% |
| Rutland UA | 70.5% |
| Derbyshire Dales | 70.4% |
| Camden Council | 70.3% |
| Hyndburn | 69.2% |
| Islington Council LB | 69.1% |
| East Riding of Yorkshire UA | 68.9% |
| Daventry | 67.1% |
| Redditch | 67.1% |
| Melton | 67.0% |
| Manchester | 66.9% |
| Lancaster | 66.7% |
| Rushmoor | 66.6% |
| Welwyn Hatfield | 66.4% |
| Haringey Council London Borough | 66.3% |
| Greenwich Council London Borough | 63.7% |
| Fenland | 63.6% |
| Salford | 63.3% |
| Newcastle-under-Lyme | 61.7% |
The data is not exact and should be taken as a close approximation using the most recently available PS1 returns.
In Quarter 3, 2011, 126 local authorities in England and Wales achieved this same milestone. I’ll be following up in the near future with features on some of these authorities and also on some of the individuals and teams that are making an impact.
I think it will take time for 100% of applications to be made online as there are probably a lot of, mainly older, Architects and architectural designers who use a drawing board and will never be converted to CAD or even computers in some cases. While it’s many years ago that I used to draw on tracing paper I think there is still a place for paper designing and paper plans & drawings, in fact the best examples are virtually works of craft and to be admired. I don’t really think it matters anyway as local authorities actually have to generate paper trails anyway as part of their statutory consultation processes.
Andrew,
I think you are correct but we’ll keep pushing on.
I agree with you regarding the quality of drawings but often hear sorry tales of those beautifully crafted works being reduced to poor quality scans.
At least if the work goes in electronically there is a better chance of it retaining its integrity throughout the process.
Personally I would find this information more useful if the actual number of applications received was given too eg for Craven 86% of how many applications were made online? If it’s 3000 applications then that is newsworthy, if it’s only 250 then maybe not so? Just my opinion!
Jenny,
Ealing average out at around 407 applications in total per month.
Craven at 41.
Brecon at 35.
Hackney at 166.
Hinckley and Bosworth 68.
The Planning Portal processes around 25,000 applications a month and growing.
Unless the Planning Portal can produce all application forms ie Change of Use.